Previous Projects
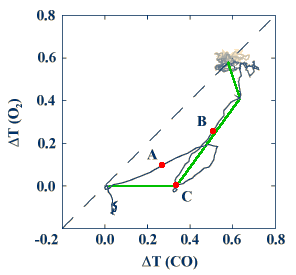
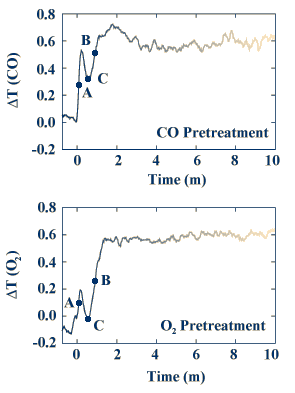
A significant difficulty in comparing transient changes in the behavior of the models with the experimental results is that all three have different timescales. Thus, the comparison is somewhat subjective. In order to make the comparisons objective, "composite graphs" were generated from the CO and oxygen pretreatment results. The figure below shows the time-series data from the pretreatments. Three points on each graph are labeled.
To form the composite graph, the temperature change following an oxygen pretreatment is plotted as a function of the temperature change following a CO pretreatment. In the figure below, the composite graph is again shown, with the same three points labeled. The shading reveals the importance of the earliest part of the transient change in the catalyst temperature as the composite graph proceeds from the lower-left to the upper-right. Once systematic errors have been taken into account, the general nature of the curve is given by the green line.