Previous Projects
We have found that traveling-wave convection in a binary mixture is an interesting system for studying spatiotemporal disorder. When TW convection is first initiated, the patterns are extemely disordered, consisting of many small domains of traveling waves, small, unstable spirals, and sources of waves. As the time passes, the pattern resolves itself into a few domains of uniform traveling waves, separated by well defined domain boundaries.
The two pictures below show the pattern before and after the coarsening transition. Frame (a) is taken immediately after the onset of convection, when the pattern is most disordered, and frame (b) is taken and after about 2 days, after the pattern has ordered itself and formed the multi-domain state.
The most straightforward method of characterizing order in a pattern is probably to take the spatial Fourier transform and look at the wave vector spectrum, or to evaluate the autocorrelation function. The Fourier transforms of the patterns in (a) and (b) are shown in frames (c) and (d). Surprisingly, the difference in the Fourier transforms is rather subtle, even though the patterns are very different.
Our goal was to find a better way to characterized the level of disorder. The key was to calculate the complex amplitude of the pattern. Basically, since the pattern is composed of traveling-waves, the intensity of the pattern at any given point oscillates in time as waves pass by. Therefore, you could describe the pattern by specifying the phase and amplitude of oscillation of each pixel. It turns out that the amplitude is rather boring, and most of the information about the pattern is contained in the phase. (See our other web page about traveling-wave states). It turns out that a good way to characterize the level of disorder is to look at the phase field. The phase field of the ordered pattern is smooth, but the phase field of the disordered pattern has many singularities (called phase defects).
A phase defect is a point in the complex amplitude where the contours of Re(A)=0 and Im(A)=0 cross, and the phase of the field is undefined. Below are close-up pictures of typical phase defects which were found in TW convection patterns. The pictures represent the phase in a rainbow palette, and contours of Re(A)=0 and Im(A)=0 are marked by black and white lines.
DISLOCATION
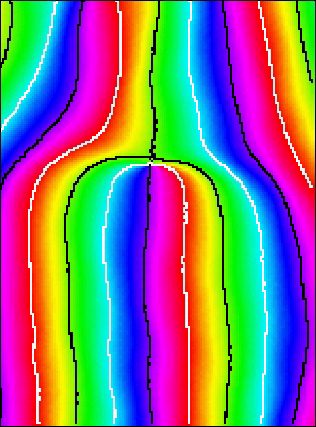
In the dislocation, a single phase defect marks the termination of a roll. A few dislocation are visible within the large domains of traveling waves in the ordered pattern, above.
ZIPPER BOUNDARY
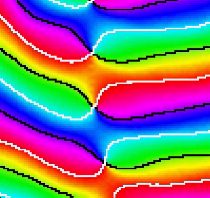
In this zipper boundary, waves are moving down on the left side, and up on the right side. Along the boundary, a row of phase defects is observed.
PERPENDICULAR BOUNDARY
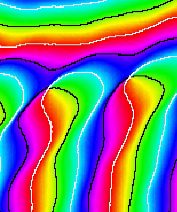
In the perpendicular boundary, waves are moving down from the top and to the left along the bottom of the pattern. Again, there is a row of phase defects along the boundary.
CROSS ROLL PATTERN
The cross roll patch is a very complicated pattern element, in which two mutually perpendicular standing waves alternate in time. This pattern manifests itself as a lattice of phase defects.
Now that the phase defects can be identified in the patterns, we can use them to characterize the level of disorder.
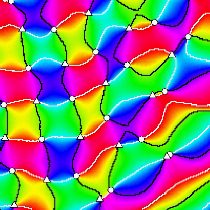
PHASE CONTOURS IN THE DISORDERED PATTERN
In this image, cyan and yellow lines represent contours of Re(A)=0 and Im(A)=0. In the disordered pattern, the phase contours form a tangled mess, because the pattern mostly consists of nonuniform cross-roll patches. Disorder is marked by a large neutral population of phase defects (at the crossings of the contour lines).
PHASE CONTOURS IN THE ORDERED PATTERN
In the ordered patterns, the contour lines cross themselves the minimum number of times possible to satisfy the boundary conditions. Order is marked by a small number of defects, all having the same topological charge.
The picture below shows the array of defects at four times during the evolution of the pattern. Defects with positive and negative topological charge are marked by circles and triangles (a little small, so they are hard to see), and the trajectories of the defects are marked by grey trails. As the pattern orders, the number of defects decreases dramatically, and the defects arrange themselves into rows.
The disordered pattern contains a high density of defects, where as the ordered pattern contains very few defects. The coarsening of the pattern can therefore be described in terms of the number of defects in the pattern. These are shown below.
The ordering of the pattern is marked by a decrease in the total number of defects, and is preceded by an accumulation of net defect charge.