Previous Projects
For appropriate choice of parameters (i.e., temperature difference) the convection rolls in a binary fluid propagate like waves. Below we show a series of pictures which describe the wave properties. The pictures were made using an algoithm which converts the traveling-wave pattern into a complex amplitude field whose modulus indicates the intensity of convection and whose phase contains information about the wave propagation properties.
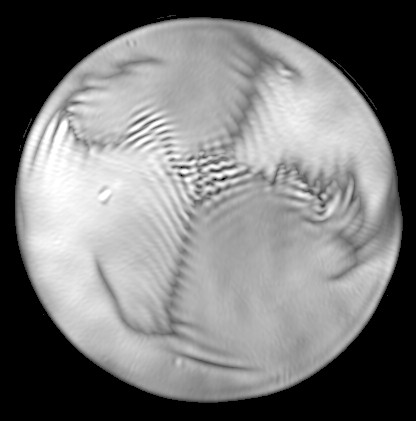
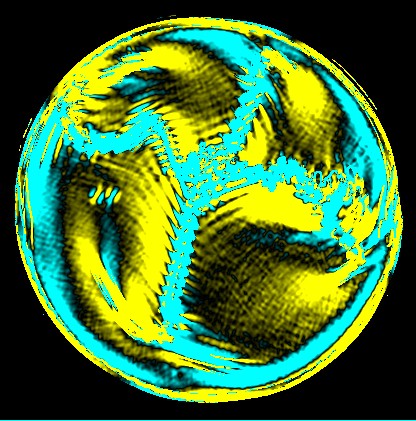
RAW IMAGE
An image of the traveling-wave pattern before analysis.
ANALYSIS
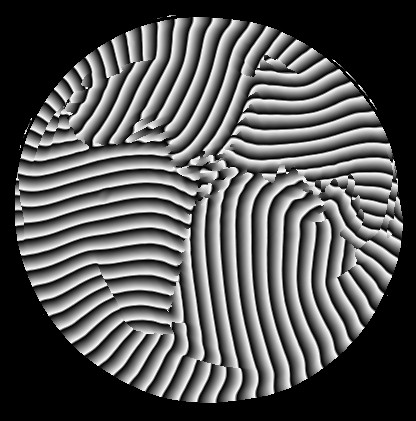
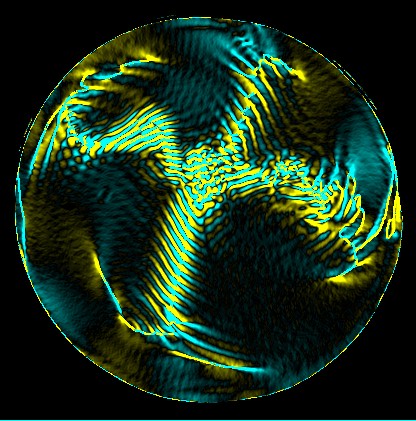
MODULUS
(Click for a full-sized image)
The modulus of the complex amplitude.
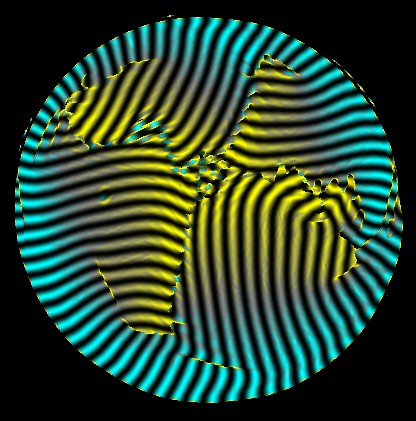
PHASE
(Click for a full-sized image)
The phase of the complex amplitude mapped to greyscale as a saw tooth. Notice that the direction of propagation of the waves can be determined from this picture. The domains of this pattern are propagating in a clockwise direction.
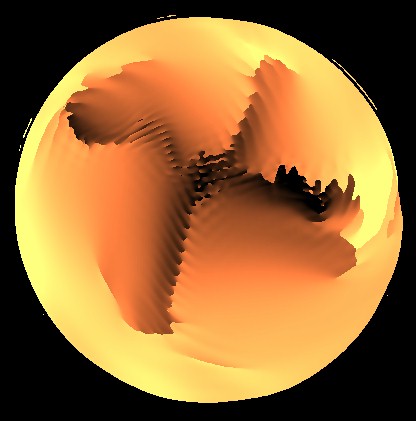
FREQUENCY
(Click for a full-sized image)
The frequency of oscillation is mapped to a temperature-style palette in which (black-yellow) corresponds to (0.2-0.55).
CURVATURE
(Click for a full-sized image)
The curvature of the roll pattern is related to the divergence of the velocity vector. In the figure (yellow,black,cyan) maps to (-0.08,0,0.08), where distance are measured in terms of roll size. Positive curvature indicates diverging waves and negative curvature indicates converging waves.
STRETCH
(Click for a full-sized image)
The instantaneous rate of stretching of the roll pattern. (yellow,black,cyan) maps to (-0.2,0,0.2).
TWIST

(Click for a full-sized image)
The instantaneous rate of twisting of the roll pattern. (yellow,black,cyan) maps to (-0.2,0,0.2).
VELOCITY
(Click for a full-sized image)
The velocity of the convection rolls. The brightness of the image indicates the convection pattern, and the hue indicates the velocity. Yellow rolls move slowly, and blue rolls move fast. The pallette mapping is (blue,yellow) to (0.4,0.58).
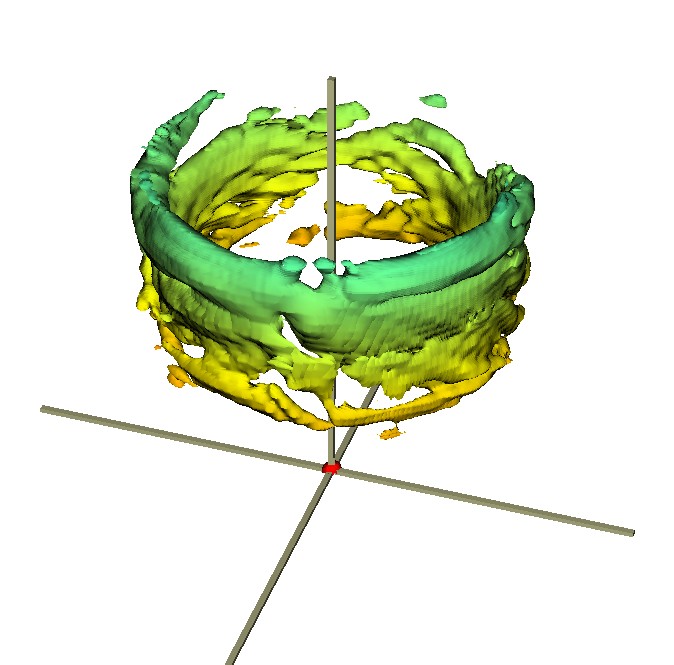
SPATIOTEMPORAL REPRESENTATION
It is difficult to represent a traveling-wave pattern with a single image because the movement of the rolls is important and hard to represent. One way to characterize the image is to look at the spatiotemporal Fourier transform. The 3D spatiotemporal Fourier transform of a TW pattern is shown below, in which the spatial frequencies kx and ky are represented on the two horizontal axes, and the temporal oscillation frequency is represented on the vertical axis. The image shows a surface of constant spectral power, where the frequency (height on the z-axis) is encoded as the color of the surface.
(Click for a full-sized image)
Another possibility is to imagine the pattern as a three dimensional volume, with two coordinates (x,y) being the spatial coordinates and the third coordinate (z) being the time. Then a horizontal slice of the pattern shows its state at a given time, and a vertical slice shows the time evolution of a strip of the pattern. We have created a representation of a TW pattern in this way. The end surface of the cylinder is the pattern at a given moment and a crossection represents time evolution.
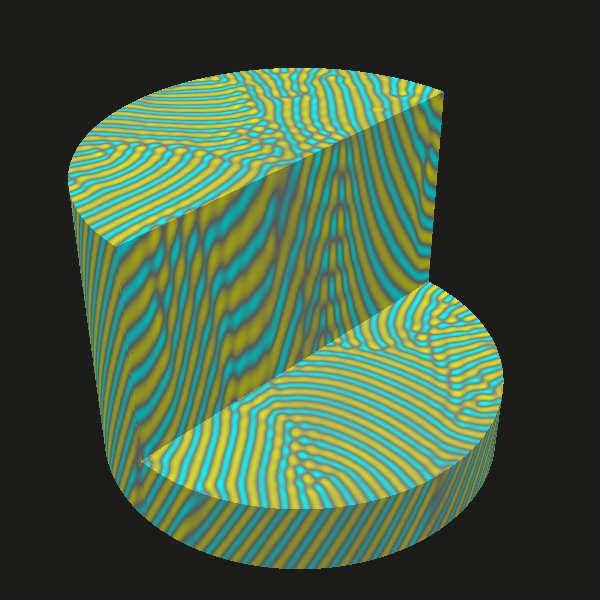
(Click for a full-sized image)
|
| "Dynamics of 2-D Traveling-Wave Convection Patterns." A. La Porta and C. M. Surko, Phys. Rev. E53, 5916 (1996). |